After reading this post, you will be able to explain what a materialized view is, create one in your own database, refresh it on a schedule that fits your data, and diagnose the most common failure modes when results go stale or queries slow down.
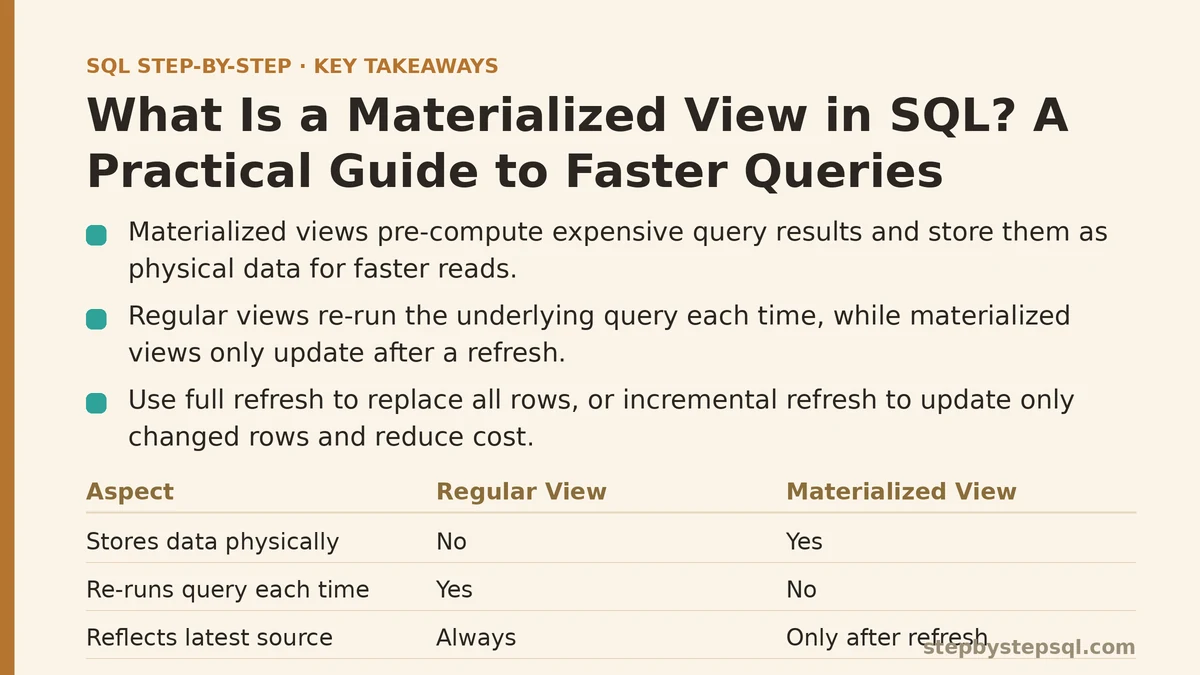
The problem materialized views solve is simple: some queries take too long to run on every request. If your dashboard executes the same heavy aggregation hundreds of times per day, you are paying the same computational cost over and over. A materialized view pre-computes that expensive result once, stores it like a table, and lets future queries read the stored answer instead of re-calculating it.
This post walks through the full picture: what distinguishes a materialized view from a regular view, a concrete creation example with verification steps, the refresh strategies you will choose between, and a troubleshooting checklist for when things go wrong.
Symptom: Your Dashboard Query Takes Seconds (or Minutes) Every Time It Runs
Cause: You are re-computing the same expensive aggregation on every page load. The database scans large tables, joins several of them, and groups millions of rows — even though the underlying data has not changed since the last request.
Fix: Replace the repeated computation with a materialized view. The first time you build it, the database runs the query once and stores the result on disk. Every subsequent query against the materialized view reads that pre-computed result directly.
A regular view does not solve this. A standard view is just a saved query definition — it re-runs the underlying SQL every time you select from it. The database still scans and joins everything on each request. A materialized view, by contrast, stores the actual result rows as physical data.
Here is the mental model difference:
| Regular View | Materialized View | |
|---|---|---|
| Stores data physically | No | Yes |
| Re-runs underlying query each time | Yes | No |
| Always reflects latest source data | Yes | Only after a refresh |
| Query speed (after build/refresh) | Same as base query | Much faster |
In PostgreSQL, MySQL, and SQL Server, you create a materialized view using CREATE MATERIALIZED VIEW followed by the query:
CREATE MATERIALIZED VIEW daily_sales_summary AS
SELECT
    DATE(transaction_time) AS sale_date,
    product_category,
    SUM(sale_amount) AS total_sales,
    COUNT(*) AS transaction_count
FROM transactions
JOIN products ON transactions.product_id = products.product_id
GROUP BY DATE(transaction_time), product_category;
After this command completes, the daily_sales_summary object behaves like a table. You can run SELECT * FROM daily_sales_summary WHERE sale_date = '2026-09-01' and get results in milliseconds, without touching the transactions or products tables.
Verification step: Compare execution times before and after.
-- Before: query the base tables directly
EXPLAIN ANALYZE
SELECT DATE(transaction_time), product_category, SUM(sale_amount), COUNT(*)
FROM transactions
JOIN products ON transactions.product_id = products.product_id
GROUP BY DATE(transaction_time), product_category;

-- After: query the materialized view
EXPLAIN ANALYZE
SELECT * FROM daily_sales_summary;
In testing, the materialized view query will show a dramatically lower execution time. The execution plan will reference the materialized view’s storage directly rather than scanning the base tables.
Symptom: The Materialized View Returns Data That Is Out of Date
Cause: Stored results do not automatically track changes to the underlying tables. If a new transaction is inserted after the view was created, the view still shows the old totals.
Fix: Refresh the view. You have two main strategies: full refresh and incremental refresh.
A full refresh re-runs the entire query and replaces all stored rows:
REFRESH MATERIALIZED VIEW daily_sales_summary;
This works everywhere, but it can be expensive. For a view built on millions of rows, a full refresh may take as long as the original query — which defeats the purpose if you refresh every few minutes.
An incremental refresh (often called concurrent refresh) updates only the changed rows. PostgreSQL supports this through REFRESH MATERIALIZED VIEW CONCURRENTLY, but it requires that the view have a unique index:
CREATE UNIQUE INDEX idx_daily_sales_summary ON daily_sales_summary (sale_date, product_category);

REFRESH MATERIALIZED VIEW CONCURRENTLY daily_sales_summary;
The concurrent refresh holds a lock briefly and does not block concurrent reads of the view. The trade-off: you must design a unique index on the view, which means your grouped columns need to identify each row uniquely.
Choose refresh frequency based on data volatility, not habit. If you run end-of-day reporting on yesterday’s transactions, a nightly refresh makes sense. If you run a live operations dashboard on streaming data, a nightly refresh is insufficient — you need a shorter interval or a different architecture. A common pattern is to schedule refreshes using a cron job or a database scheduler:
# Every 5 minutes, refresh the view concurrently
*/5 * * * * psql -c "REFRESH MATERIALIZED VIEW CONCURRENTLY daily_sales_summary;" my_database
In PostgreSQL, you can also use pg_cron to keep the scheduling inside the database:
SELECT cron.schedule('refresh-sales-summary', '*/5 * * * *',
    $$REFRESH MATERIALIZED VIEW CONCURRENTLY daily_sales_summary$$);
In SQL Server, you would use indexed views with SET ANSI_NULLS ON and SET ANSI_WARNINGS ON, and the database engine keeps the index synchronized automatically on INSERT, UPDATE, and DELETE operations against the base tables. MySQL does not support materialized views natively (though it has generated columns and event scheduling that can partially approximate them), so in MySQL you typically implement a summary table with triggers or an event scheduler.
Symptom: Your Refresh Costs More Than the Query Itself
Cause: You built a materialized view on a query that depends on highly volatile data, and you are refreshing it too frequently — or your full refresh is so expensive that it blocks other writes.
Fix: Apply the trade-off matrix consistently. A materialized view earns its keep only when the query is read far more often than the underlying data changes. If your data changes every second but you only read it once a minute, you are refreshing thirty times per unnecessary rebuild decision — there are scenarios where a direct query against the base tables would cost less than the refresh cycle.
This is the litmus test: use a materialized view when the ratio of reads to writes is high and the query is expensive. If you have a 10-second aggregation queried 100 times per day, the materialized view pays for itself. If you have a 10-second aggregation queried twice per day, just run the query directly.
Start with these concrete thresholds (adjust for your hardware):
- If the query takes under 100 milliseconds and runs fewer than 10 times per minute, a materialized view adds complexity without benefit.
- If the query takes over 1 second and runs more than once per minute, a materialized view is worth evaluating.
- If your refresh interval is shorter than the query’s own execution time, something is wrong — the refresh will never catch up with the data change rate.
When to reject materialized views entirely:
- Your query is not deterministic per refresh. For example, a query using
CURRENT_DATEto derive “last 7 days” will freeze the date at refresh time. That is an anti-pattern; a regular view or a query parameter would serve better. - Your data updates are frequent and you cannot tolerate staleness. If your financial reports must reflect transactions within seconds, and the aggregation spans millions of rows, a materialized view with a 5-minute refresh may be too stale.
- Your storage is constrained. A materialized view duplicates data. A large one can consume meaningful disk space — you can verify size with
SELECT pg_size_pretty(pg_total_relation_size('daily_sales_summary'));in PostgreSQL.
Symptom: The View Fails to Refresh, or the Refresh Fails Mid-Way
Cause: Conflicting locks, missing privileges, or query design limitations. In testing, the most common causes are:
- Concurrent selects during a full refresh.
REFRESH MATERIALIZED VIEW(withoutCONCURRENTLY) takes an exclusive lock on the view, blocking reads until it finishes. If your refresh runs for minutes, your dashboard goes blank during that window. - Missing unique index for
CONCURRENTLY. PostgreSQL throws an error if you try concurrent refresh without a unique index. - Privilege gaps. The role running the refresh needs
REFRESHprivilege on the view andSELECTprivilege on the base tables.
Fix checklist (symptom → cause → fix):
| Symptom | Cause | Fix |
|---|---|---|
| Refresh blocks reads for minutes | Full refresh exclusive lock | Use REFRESH MATERIALIZED VIEW CONCURRENTLY with a unique index, or schedule refresh in low-traffic hours |
| Error: “cannot refresh materialized view … concurrently” | Missing unique index | CREATE UNIQUE INDEX on the view’s grouped columns |
| Refresh succeeds but data is wrong | Query references volatile functions like NOW() or CURRENT_DATE during creation | Replace with a parameterized query or a regular view with a date-filter column |
| View is empty after refresh | The underlying query returns zero rows because of a filter condition that changed | Review the WHERE clause — it runs at build time, not at query time |
| Refresh fails with permission denied | Privilege gap | Grant REFRESH and SELECT on all involved objects |
Concrete troubleshooting walkthrough:
If your concurrent refresh fails, run this diagnostic sequence:
-- 1. Check for a unique index on the view
SELECT indexname, indexdef
FROM pg_indexes
WHERE tablename = 'daily_sales_summary';

-- 2. If nothing is returned, create one. The index must cover all columns
-- that uniquely identify each row of the view.
CREATE UNIQUE INDEX idx_daily_sales_summary
ON daily_sales_summary (sale_date, product_category);

-- 3. Retry the concurrent refresh
REFRESH MATERIALIZED VIEW CONCURRENTLY daily_sales_summary;

-- 4. Verify freshness
SELECT MAX(sale_date) FROM daily_sales_summary;
If MAX(sale_date) is older than the latest data in your base table, your refresh schedule is the problem. Check the cron job or pg_cron schedule, and confirm the job is running with SELECT * FROM cron.job; (for pg_cron) or by checking the system logs.
Symptom: You Cannot Decide Which Columns to Group or Which Tables to Join
Cause: Materialized view design is a trade-off, not a pure optimization. The more columns you store, the more storage you consume and the slower the refresh becomes. The fewer columns you store, the more likely you will need another view for a different question.
Fix: Follow this decision checklist:
- Start from the slow query you run. Do not build a materialized view for a hypothetical future need. Find the query that shows up in your slow-query log.
- Apply the filter in the view’s
WHEREclause at creation time. The view stores only filtered results. If you routinely ask for “last 30 days,” filter in the view. - Limit the grouped columns. Group by the dimensions you report on. Adding
product_brandto a group that only needsproduct_categorydoubles storage. - Prefer a narrow set of metrics. Store the sums, counts, and averages you need. You can run additional aggregation on top of the materialized view if a different metric shows up later — at that point you are querying a small pre-computed set, still far cheaper than the base tables.
- Create separate views for distinct questions. A single materialized view that tries to answer “daily sales by category and by region and by customer type” will either be too wide or require a very large grouping set. Split the problem: one view for category-level daily totals, another for regional weekly totals.
Example of a too-wide view (avoid this):
-- Problem: groups by five dimensions, stores every combination
CREATE MATERIALIZED VIEW overly_broad_summary AS
SELECT
    DATE(transaction_time),
    product_category,
    product_brand,
    customer_region,
    customer_type,
    SUM(sale_amount),
    COUNT(*)
FROM transactions
JOIN products ON transactions.product_id = products.product_id
JOIN customers ON transactions.customer_id = customers.customer_id
GROUP BY
    DATE(transaction_time),
    product_category,
    product_brand,
    customer_region,
    customer_type;
This view multiplies row counts across all dimension combinations. If you have 10 categories, 50 brands, 20 regions, and 5 customer types, that is 10 × 50 × 20 × 5 = 50,000 potential groups per day — likely far more than the data supports, but the storage cost is not trivial.
Better approach — two narrow views:
CREATE MATERIALIZED VIEW daily_sales_by_category AS
SELECT DATE(transaction_time), product_category, SUM(sale_amount), COUNT(*)
FROM transactions JOIN products ON transactions.product_id = products.product_id
GROUP BY DATE(transaction_time), product_category;

CREATE MATERIALIZED VIEW weekly_sales_by_region AS
SELECT DATE_TRUNC('week', transaction_time), customer_region, SUM(sale_amount), COUNT(*)
FROM transactions JOIN customers ON transactions.customer_id = customers.customer_id
GROUP BY DATE_TRUNC('week', transaction_time), customer_region;
Each view is smaller, refreshes faster, and serves a specific reporting need. When a new question appears, you add a new narrow view rather than widening an existing one.
Symptom: The Materialized View Is Correct but the Dashboard Still Feels Slow
Cause: The materialized view itself is fast, but you are querying it with poor join patterns, missing indexes on the view’s own columns, or applying heavy computation (like a CASE expression with many branches) on every read.
Fix: Treat the materialized view as a table. That means:
- Index the columns you filter on. If the dashboard filters by
sale_date, an index onsale_datewithin the materialized view speeds up that lookup:
CREATE INDEX idx_daily_sales_summary_date ON daily_sales_summary (sale_date);
Flatten the joins. A materialized view that joins five tables into a single stored result means your dashboard queries touch one object, not five. That is already a win. But if the view itself stores only keys and the dashboard joins back to the base tables for names, you are re-introducing the joins on every read. Store the descriptive columns (category names, customer names) inside the view — that is the entire point of pre-joining.
Reduce per-query computation. If your dashboard applies a 20-branch
CASEstatement to categorize sales amounts, compute that classification inside the view at build time, not on every dashboard request.
CREATE MATERIALIZED VIEW daily_sales_summary AS
SELECT
    DATE(transaction_time) AS sale_date,
    product_category,
    CASE
        WHEN SUM(sale_amount) < 10000 THEN 'low'
        WHEN SUM(sale_amount) < 100000 THEN 'medium'
        ELSE 'high'
    END AS sales_tier,
    SUM(sale_amount) AS total_sales,
    COUNT(*) AS transaction_count
FROM transactions
JOIN products ON transactions.product_id = products.product_id
GROUP BY DATE(transaction_time), product_category;
Now the dashboard reads daily_sales_summary and gets the tier directly. No per-row computation at query time.
The Decision Framework
If you only take one thing from this post, make it this:
- A materialized view is a pre-computed table, not a live query. Use it for expensive, frequently repeated reads over data that does not change constantly.
- Full refresh replaces everything; concurrent refresh patches only the changed rows. Use concurrent if your database supports it and you can maintain a unique index.
- Storage and staleness are the real taxes. Verify the ratio of reads to writes before committing to a materialized view across dozens of tables.
- A view that is refreshed too often is worse than no view at all — you pay refresh cost plus storage without saving meaningful read time.
Run EXPLAIN ANALYZE on your slowest dashboard query. If it takes over a second, try building a narrow materialized view on it, index the filter column, and measure the difference on your next dashboard load. If the data changes more often than once a minute, you should probably skip the materialized view and revisit your base-table indexing strategy instead.
Related guides: Common Indexing Mistakes That Silently Slow Down Your SQL Queries, How SQL Indexes Actually Speed Up Your Queries (And When They Slow You Down Instead), and SQL Execution Plan Basics: How to Read Query Plans Like a Professional.